AI-powered geophysical technology “Deep Vision” was developed on the base of deep scientific investigations of the USSR. The uniqueness of our technology is the complex approach comprising remote sensing and on-site prospecting. In both cases, we utilize the same physical principle, which is called “superweak nuclear magnetic resonance interaction” (NMR). It was discovered before, and now we proved, that multispectral satellite images bears information not only about visible objects but also about hidden objects, which leave their footprint at the visible part of images. We developed innovative remote sensing method, which allows to make the search of any mineral deposit (oil, gas, gold, coal and any other mineral) only by means of modern digital multispectral satellite images, utilizing up-to-date IT instruments like machine learning and artificial intelligence. The quantity of such images is huge, which allows us to conduct a remote sensing for almost all parts of the world, but in case of necessity we can order satellite image the precise part of the globe. Using satellite images, we can conduct a search for mineral deposits quickly and precisely, and narrow area of investigation from the thousands of square kilometers up to anomaly borders. After that, using our mobile equipment, we are able to define precise contours of the anomaly, precise depth of its bedding and create 3D-shape of the anomaly’s body.
Below we want to explain how our remote sensing system and on-site equipment works at different stage of the investigation.
For the start of investigation, we need to know coordinates of area and type of searched minerals. Based on the coordinates we order satellite images. We have a big library of different minerals samples. If we do not have samples of searched mineral, we try to find or pure mineral on the market, or can ask from the client near 100 gr. of ore, which contains this mineral.
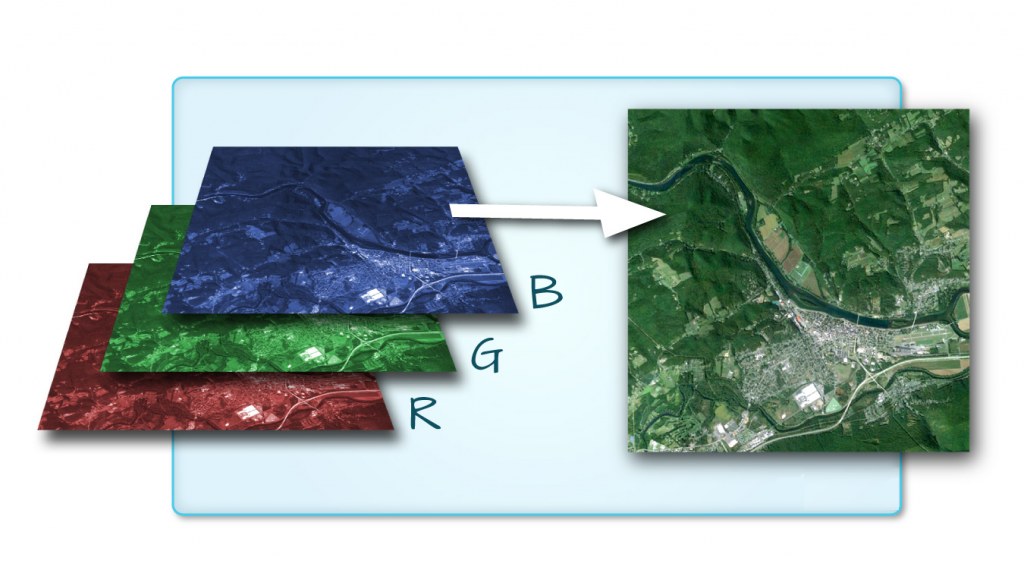
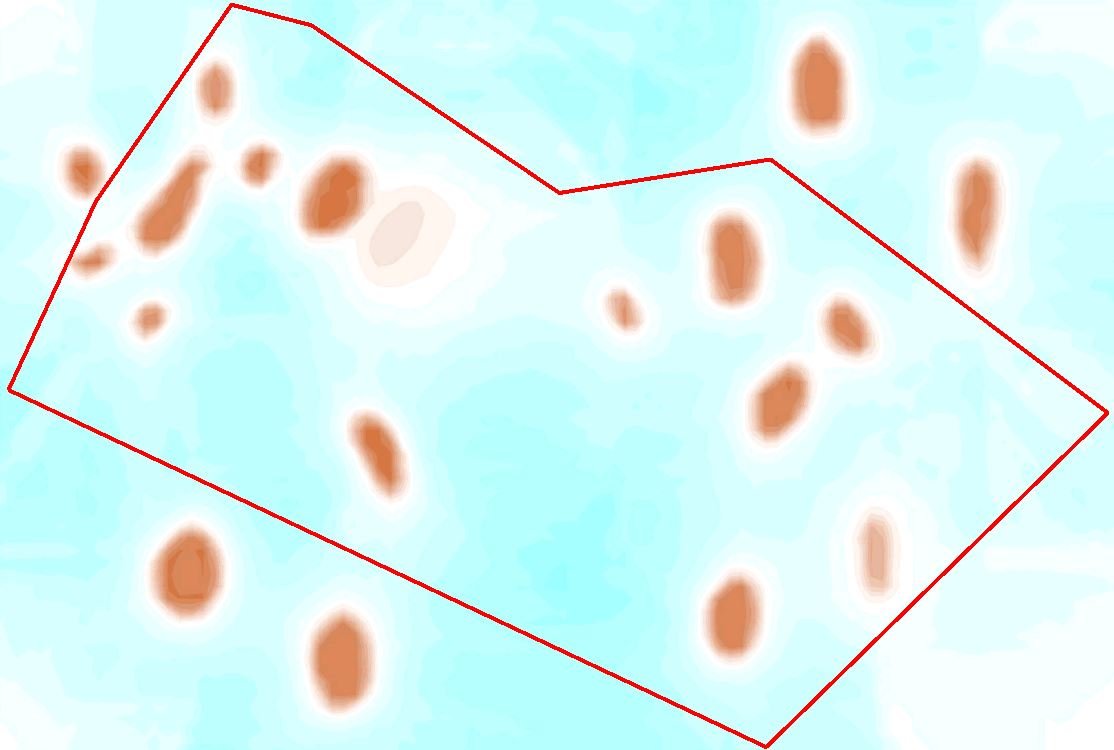
We order satellite images for the same place and try to have images which were shot from the different angle of view. Images with a different angle of shooting allow us to calculate the preliminary depth of bedding, using the deviation of the contours of the found anomaly on the surface. The sample of multispectral satellite images you can see below.
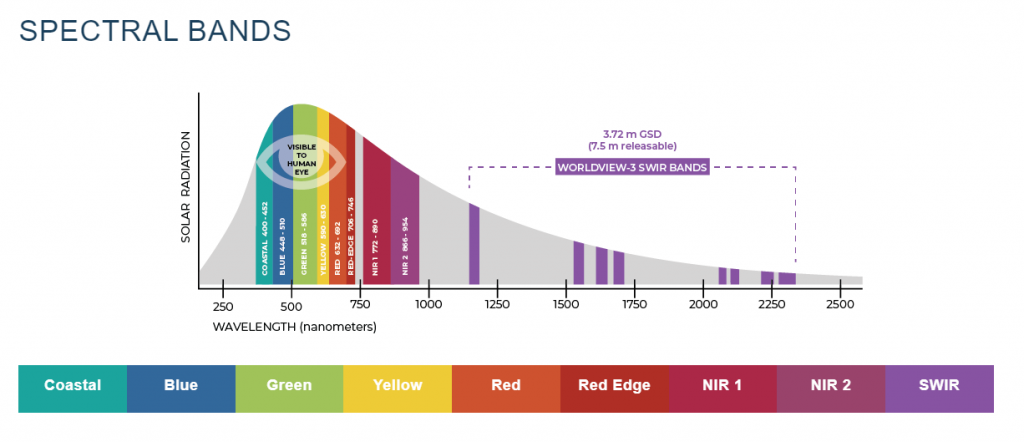
Multispectral images can have more than 3 bands, and, depending from the searched substance, we can use all bands or only part of it.
At the next image, you can see the zone of interest. Sometimes we need to use a few images to cover the full area of search and to have desired resolution for detailed search and survey.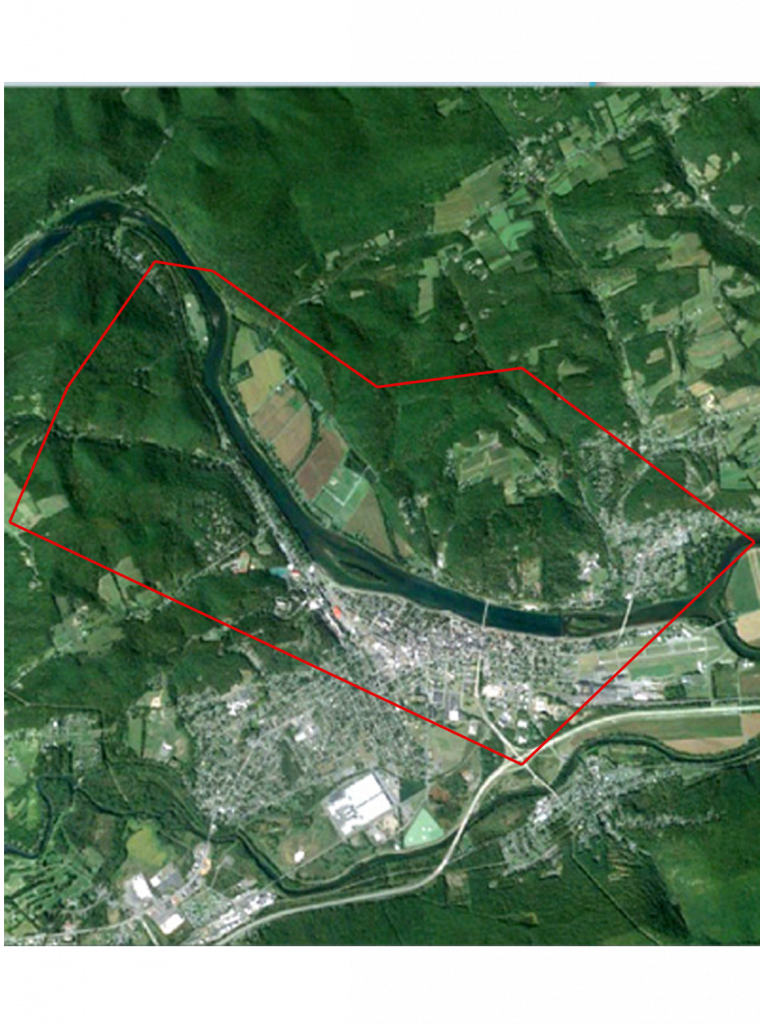
Each substance has own footprint on the visible spectrum of image, and own wavelength which can be recognized by slight shift of the different part of image. Only one thing is important to know to find this substance – it own wave which interfere with specific band (all bands). We developed algorythm of search such shifts and created big library of digital samples for the most of searched minerals. To start search we only need to take big quantity of different satellite images of the area and implement specialy trained machine learning model. Model was trained by means of million different images with proven presence of mineral deposits and is able to recognize anomalies based on micro changes in the spectral characteriscics of the image. AI helps us to prepare images for processing by ML model, remove deviations and increase accuracy of prediction. We developed proprietary library with some similarity to TesorFlow and ML.Net.
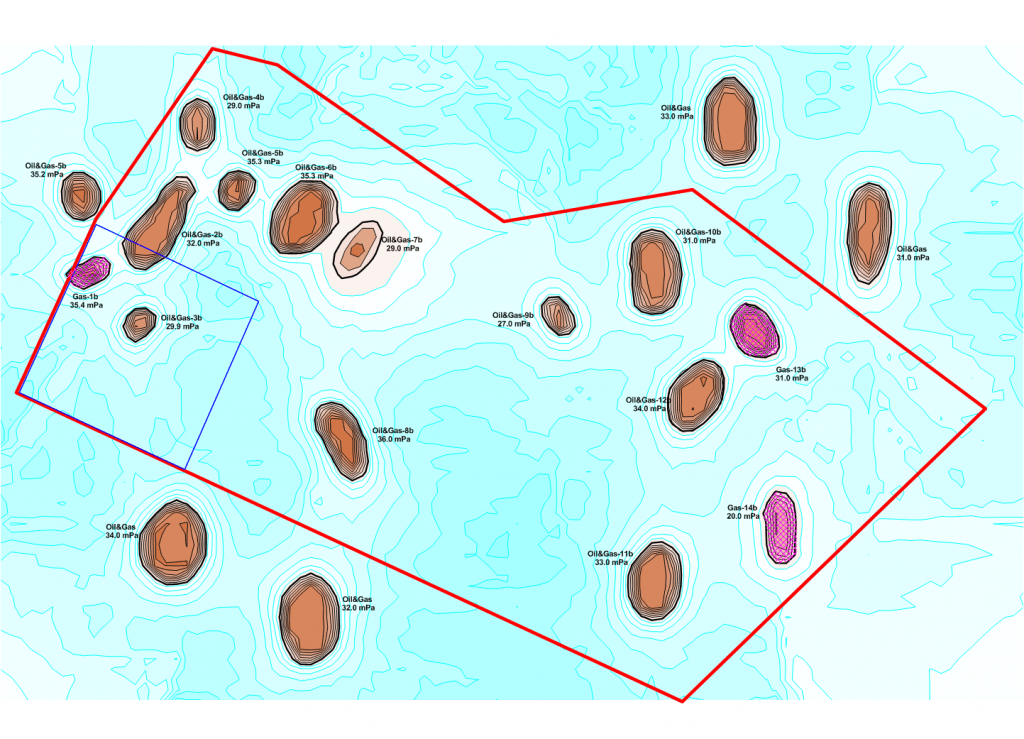
For obtainment of reliable results, we are doing a lot of iteration and statistical treatment. We are able to correct (calibrate) the model based on different geological and geophysacal data. So, at the end of the treatment, we obtained spots as a prediction of an anomaly for the on-site investigation. Here we found some trick, which allows us to calculate the preliminary depth of bedding. Using few images, we obtained different results of placement the found spots. Having deviation, the angle of shooting and distance to the surface for each image, we are able to calculate preliminary depth. Of cause, it is better to prove preliminary data with on-site investigation, but the Customer can have a preliminary estimation of bedding depth.
Moving forward, we digitize received results and create maps of the area with found anomalies.
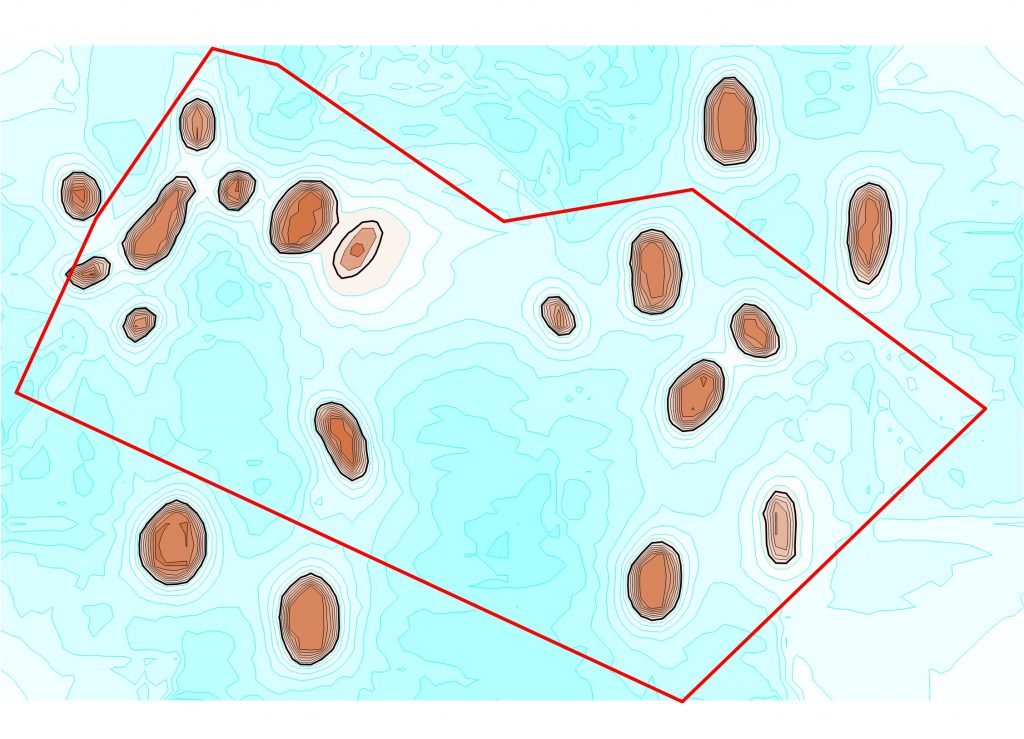
Final map
At expedition, we need to review preliminary results and obtain more exact data about borders and depths. We planned a route with tasks to check the preliminary borders and conduct point investigation.
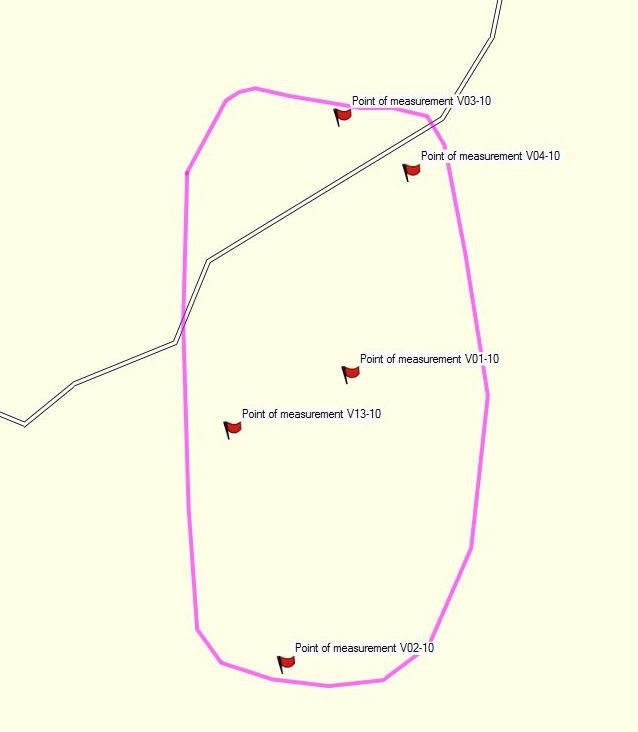
Maps with result tracks
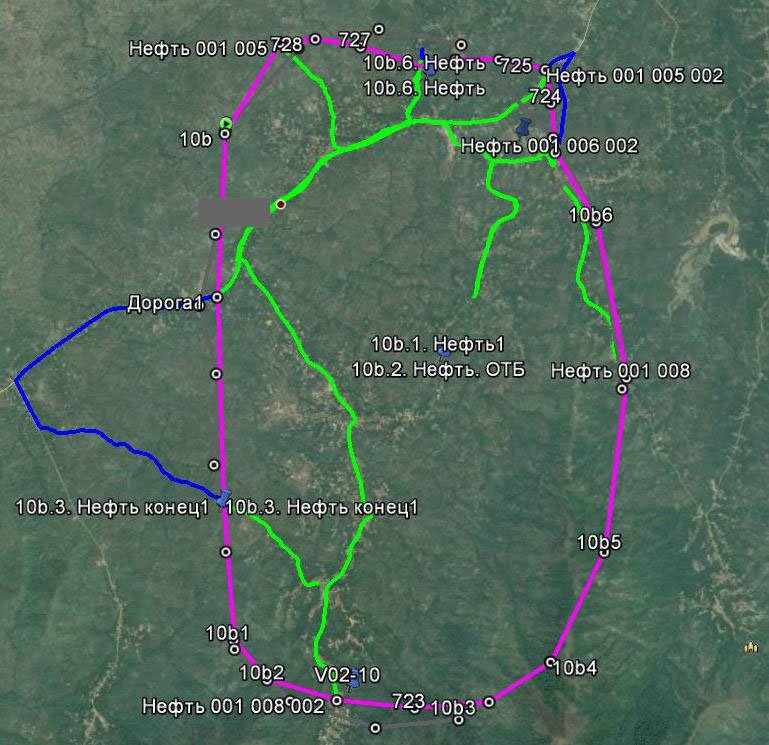
Green lines show the presence signal from the substance, blue lines show the absence of a signal from the substance. Our data show, that is not possible to go everywhere we need to check borders, we limited by roads and time.
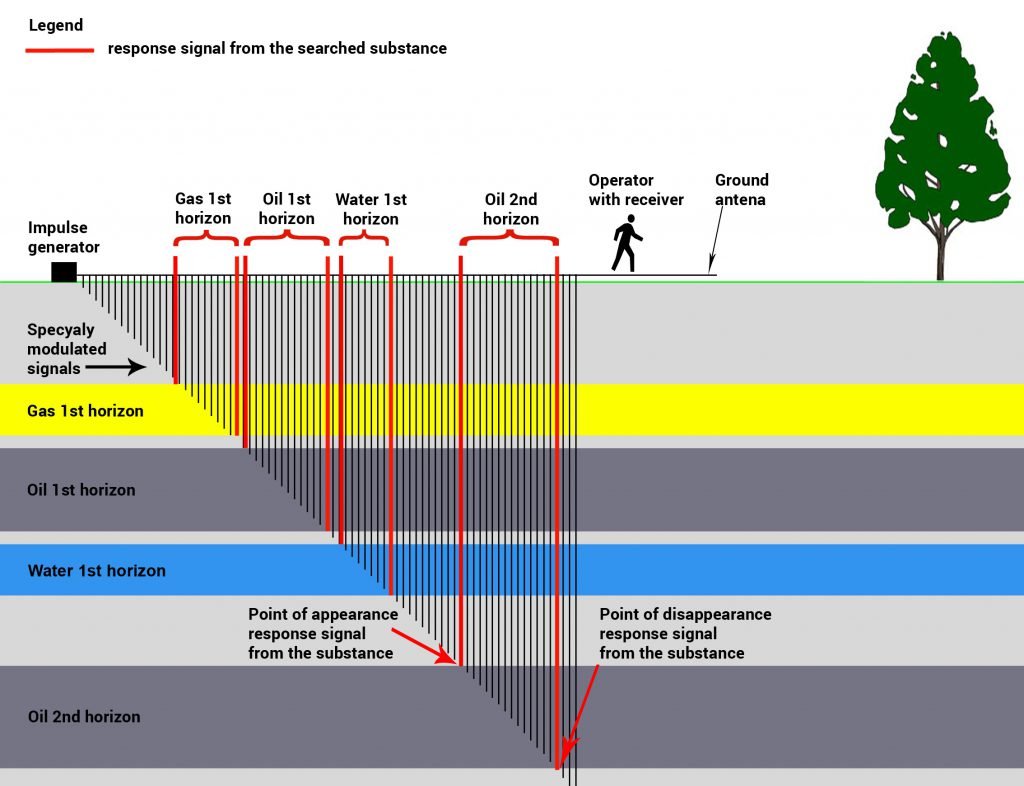
The idea of point investigation is shown at the next picture.
After the point investigation, we obtained column with following data.
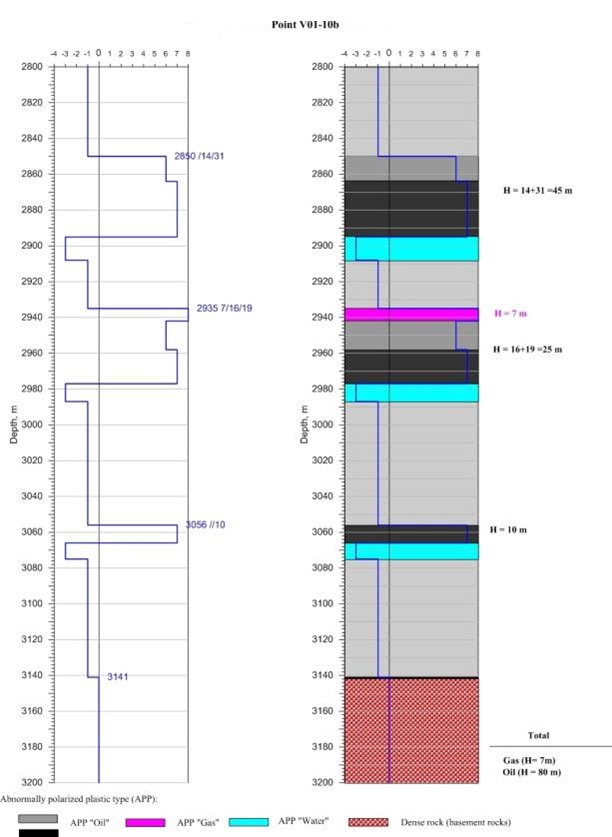
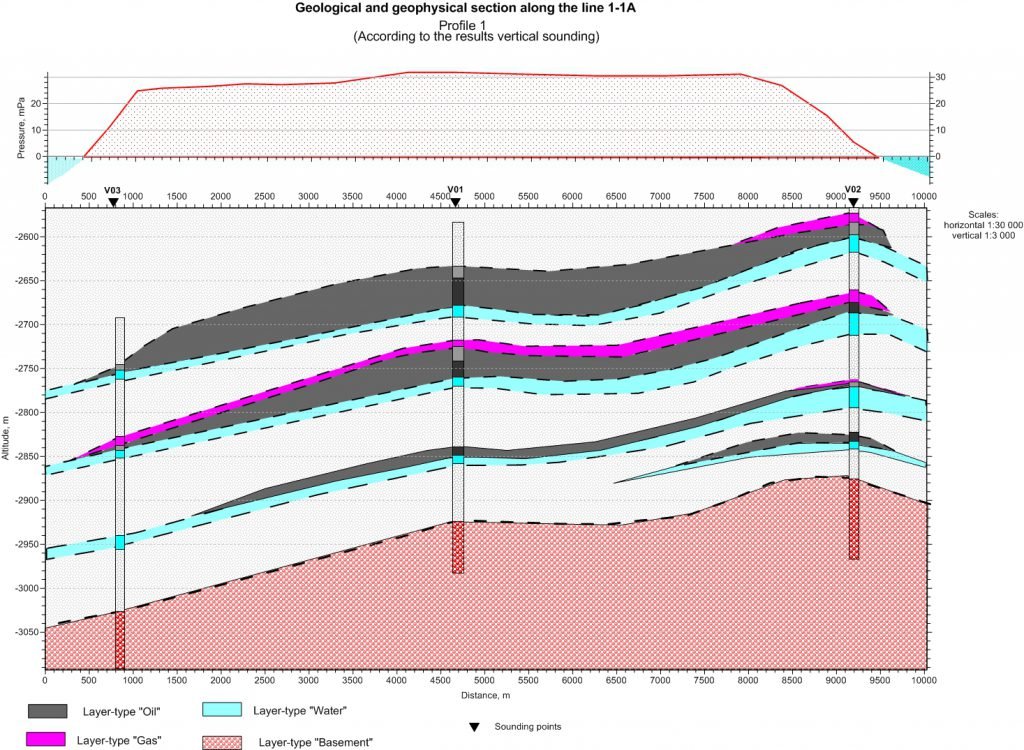
Based on point investigations, we are able to build underground cuts. More point we will have, more correct cut we will build. The back side of accuracy is the time and cost. For one expedition day, we are able to investigate 5-6 points.
We hope that our explanation will help you better understand the principle of work and practical implementation of our technology.